
Brief Report on China's Sewing Machinery Industry Import & Export (Jan–Aug 2026)
According to the latest data from the General Administration of Customs, China's sewing machinery exports maintained a modest and steady growth from January to August 2026, with total exports reaching USD 2.734 billion, up 1.95% year-on-year. Despite sluggish global economic growth, the industry demonstrated strong resilience through product structure upgrades and market diversification. However, performance varied significantly across product segments and export markets, while imports continued to undergo deep adjustments.
I. Overall Modest Growth in Exports with Clear Divergence in Product Structure
From January to August, China's sewing machinery exports exhibited dual characteristics of "stable volume with improved quality" and "uneven performance across categories." By product category, embroidery machines emerged as the bright spot, with export value reaching USD 787 million, representing a substantial year-on-year increase of 20.79%, despite a 4.43% year-on-year decline in export volume, highlighting a clear trend toward high-end and high-value-added development. Pre-sewing and post-sewing equipment demonstrated steady performance, with export value reaching USD 402 million, slightly down by 1.36% year-on-year, while export volume surged by 22.05%.
In contrast, traditional core categories faced visible pressure. Export volume of household sewing machines rose by 4.23% year-on-year, but export value dropped by 7.60%, indicating significant downward pressure on unit prices. Export value of industrial sewing machines fell by 4.98% year-on-year, while that of sewing machine parts and components decreased by 2.59% year-on-year, reflecting cautious investment sentiment in the downstream apparel industry.
China's Sewing Machinery Exports (Jan–Aug 2026)
(Unit: Units, kg, USD, %)
|
Category |
Export |
YoY Growth |
||
|
Volume |
Value |
Volume |
Value |
|
|
Household Sewing Machines |
6,621,745 |
146,822,169 |
4.23 |
-7.60 |
|
Industrial Sewing Machines |
3,554,749 |
1,100,146,337 |
0.87 |
-4.98 |
|
Embroidery Machines |
91,429 |
786,603,890 |
-4.43 |
20.79 |
|
Pre-Sewing and Post-Sewing Equipment |
1,652,814 |
401,887,523 |
22.05 |
-1.36 |
|
Sewing Machine Parts |
63,866,148 |
298,923,593 |
-3.66 |
-2.56 |
|
Total Export Value |
-- |
2,734,383,512 |
-- |
1.95 |
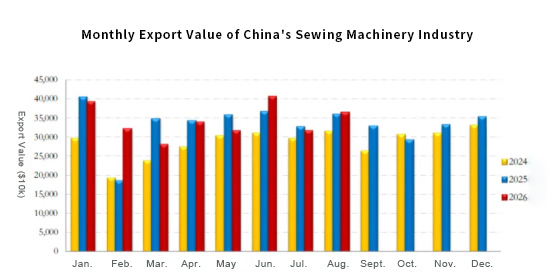
Focusing on the single month of August, the export value reached USD 365 million, representing a year-on-year increase of 1.91% and a quarter-on-quarter (month-on-month) growth of 15.37%, showing a marked increase compared to the previous month. Except for embroidery machines, which saw a surge of 38.19% in export value MoM, all other categories experienced varying degrees of decline. Among them, household sewing machines and industrial sewing machines dropped significantly by 18.06% and 14.47% MoM respectively, signaling weakened external demand momentum.
China's Sewing Machinery Exports (August 2026)
(Unit: Units, kg, USD, %)
|
Category |
Export |
YoY Change |
||
|
Volume |
Value |
Volume |
Value |
|
|
Household Sewing Machines |
835,099 |
16,824,405 |
-18.06 |
-16.69 |
|
Industrial Sewing Machines |
407,346 |
125,742,029 |
-18.98 |
-14.50 |
|
Embroidery Machines |
14,405 |
133,777,455 |
-14.74 |
38.19 |
|
Pre-Sewing and Post-Sewing Equipment |
203,078 |
53,867,234 |
-4.40 |
-8.67 |
|
Sewing Machine Parts |
8,132,256 |
34,808,694 |
-2.12 |
-0.88 |
|
Total Export Value |
-- |
365,019,817 |
-- |
1.91 |
II. Market Landscape Accelerates Restructuring with Asia and Europe Showing Standout Performance
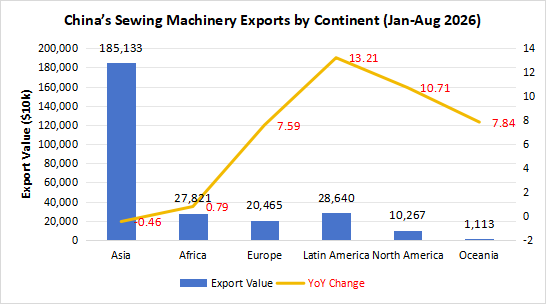
Structural shifts across export markets are particularly striking. Although Asia remains the dominant regional market, with export value reaching USD 1.851 billion from January to August, it saw a slight year-on-year drop of 0.46%. Within the region, India demonstrated remarkably strong momentum, with exports reaching USD 699.6 million, a sharp year-on-year surge of 31.27%. India firmly holds its position as China's largest single export market for sewing machinery, raising its market share to 25.59%. Meanwhile, Uzbekistan recorded a 35.84% year-on-year growth and Indonesia increased by 7.14%, both expanding their respective market shares.
In contrast, Vietnam, a traditional manufacturing hub, came under visible pressure. From January to August, China's exports to Vietnam totaled USD 258 million, down 16.32% year-on-year, with its market share shrinking by 2.06 percentage points. This reflects partial capacity migration or temporary local market saturation.
European markets emerged as a major growth engine, with exports expanding by 31.24% year-on-year from January to August, led by a 17.69% rise in exports to Germany. Latin America delivered strong performance with a 13.21% year-on-year increase in exports, driven by rapid growth in Brazil (+14.04%) and Peru (+46.32%). Africa remained generally stable (+0.79%), with Nigeria showing outstanding performance (+21.53%). The North American market rose by 10.71% year-on-year, within which exports to the United States grew by 11.83%, outperforming expectations.
Of particular concern, exports to RCEP member countries dropped by 14.60% year-on-year, ASEAN declined by 15.85%, and Western Asia experienced a sharp contraction of 26.42%, indicating a contraction in demand across certain regional markets.
China's Sewing Machinery Exports by Major Regional & Country Markets (Jan–Aug 2026)
|
Country/Region |
Value ($) |
YoY Change (%) |
Share (%) |
Share Change (%) |
|
India |
699,628,791 |
31.27 |
25.59 |
5.71 |
|
Vietnam |
257,854,039 |
-16.32 |
9.43 |
-2.06 |
|
Pakistan |
117,820,426 |
-13.96 |
4.31 |
-0.80 |
|
Bangladesh |
111,262,610 |
-4.52 |
4.07 |
-0.28 |
|
Indonesia |
108,353,326 |
7.14 |
3.96 |
0.19 |
|
Brazil |
107,923,219 |
14.04 |
3.95 |
0.42 |
|
USA |
94,611,085 |
11.83 |
3.46 |
0.31 |
|
Cambodia |
93,191,719 |
-24.15 |
3.41 |
-1.17 |
|
Egypt |
75,373,299 |
5.64 |
2.76 |
0.10 |
|
Russia |
65,186,113 |
4.54 |
2.38 |
0.06 |
|
Uzbekistan |
44,382,580 |
35.84 |
1.62 |
0.40 |
|
Malaysia |
43,877,043 |
2.84 |
1.60 |
0.01 |
|
Japan |
43,214,691 |
-12.11 |
1.58 |
-0.25 |
|
Nigeria |
42,169,545 |
21.53 |
1.54 |
0.25 |
|
Türkiye |
38,535,330 |
-14.66 |
1.41 |
-0.27 |
|
Colombia |
35,826,998 |
26.64 |
1.31 |
0.26 |
|
Mexico |
35,622,355 |
2.96 |
1.30 |
0.01 |
|
Singapore |
31,703,818 |
-36.11 |
1.16 |
-0.69 |
|
Peru |
31,449,607 |
46.32 |
1.15 |
0.35 |
|
Thailand |
29,394,803 |
-39.15 |
1.08 |
-0.73 |
|
Sri Lanka |
26,200,092 |
8.11 |
0.96 |
0.05 |
III. Imports Remain Sluggish as Domestic Substitution Accelerates
Compared with the resilience of exports, import data paints a chilly picture. From January to August, among China's major source countries for sewing machinery imports, imports from Japan plunged by 36.40% year-on-year to USD 177 million, with its market share dropping by 8.48 percentage points. This reflects an accelerating substitution effect of domestic machinery for high-end Japanese equipment. Imports from Germany fell by 20.04% year-on-year, Czechia dropped by 42.67%, and Italy declined by 16.58%. In sharp contrast, imports from Denmark skyrocketed by 3,467.77% year-on-year and Switzerland surged by 101.61%, signaling that the industry still relies on European imports for specific ultra-high-precision or specialized equipment.
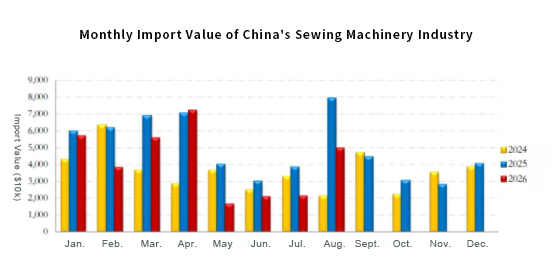
Judging from monthly import trends, overall import values in 2026 remained at multi-year lows for the same period compared to recent three years, indicating an irreversible contraction trend in industry imports.
China's Sewing Machinery Imports by Major Source Markets (Jan–Aug 2026)
|
Country/Region |
Value ($) |
YoY Change (%) |
Share (%) |
Share Change (%) |
|
Japan |
177,290,623 |
-36.40 |
53.91 |
-8.48 |
|
Germany |
59,179,559 |
-20.04 |
17.99 |
1.43 |
|
Vietnam |
43,130,347 |
5.80 |
13.11 |
3.99 |
|
Taiwan, China |
12,696,334 |
-12.92 |
3.86 |
0.60 |
|
Czechia |
7,747,219 |
-42.67 |
2.36 |
-0.67 |
|
Italy |
7,003,300 |
-16.58 |
2.13 |
0.25 |
|
Switzerland |
4,284,968 |
101.61 |
1.30 |
0.83 |
|
France |
4,258,768 |
18.65 |
1.23 |
0.47 |
|
China |
3,182,226 |
52.66 |
0.97 |
0.50 |
|
Denmark |
2,488,053 |
3467.77 |
0.76 |
0.74 |
IV. Outlook
Overall, in the first eight months of 2026, China's sewing machinery exports achieved modest growth amid a complex external environment, primarily driven by industrial structural upgrades and market diversification. However, the month-on-month weakness in August exports, alongside contractions in regional markets such as RCEP and Western Asia, indicates that downward pressure on exports persists for the second half of the year. The industry must continue to monitor shift trends in the global apparel manufacturing sector and step up R&D in high-value-added products to navigate increasingly fierce international competition. To address the challenges ahead, KOLAM continues to modernize its garment manufacturing equipment to meet dynamic market needs. By continuously advancing our smart equipment capabilities, we stay ahead of industry trends while consistently delivering value to our clients.


[About Us]
Youtube://www.youtube.com/@kwonglam-2012
Facebook:////www.facebook.com/kwonglamsew
Website:////www.zjkwonglam.com/
US Market Exclusive |JUKI 110V Voltage Customization Service
Related Article